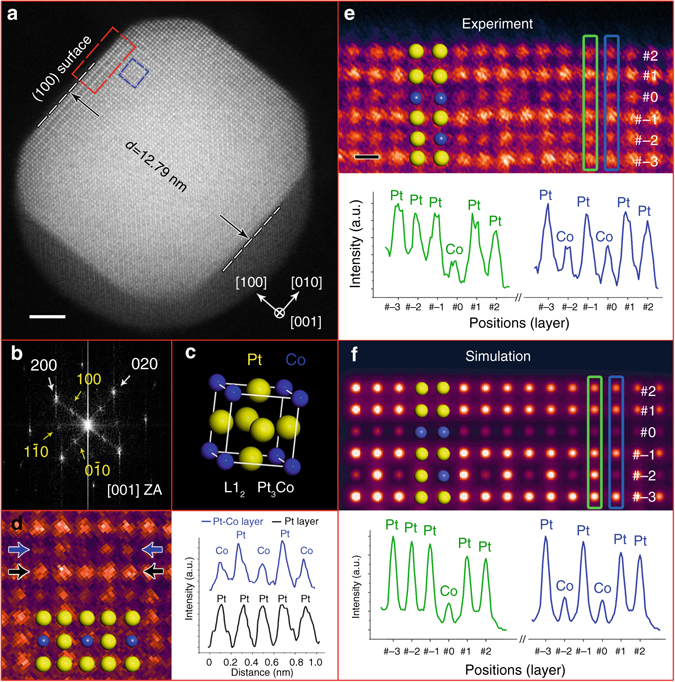
Fig. 2.

In situ results from a Pt3Co NP after oxygen annealing at 720 °C. a HAADF-STEM image taken inside the gas cell showing the Pt3Co NP after a 30-min annealing in oxygen atmosphere. Scale bar, 2 nm. b FFT pattern of the NP in a. c Unit cell of the L12 phase illustrating the ordered intermetallic Pt3Co structure. Yellow and blue spheres represent Pt and Co atoms, respectively. d A false-colour cropped image of the ordered intermetallic feature taken from the blue box in a and the intensity profiles taken along the lines indicated by the blue and black arrows, respectively. e Enlarged false colour image of the (100) surface taken from the red box in a, and the intensity profiles taken along the atomic layers marked by green and blue rectangles showing the segregated Pt-rich surface. Scale bar, 2 Å. f Simulated HAADF-STEM image of a L12 intermetallic Pt3Co model with Pt-segregated surfaces, and the intensity profiles from the two atomic layers marked by green and blue rectangles
