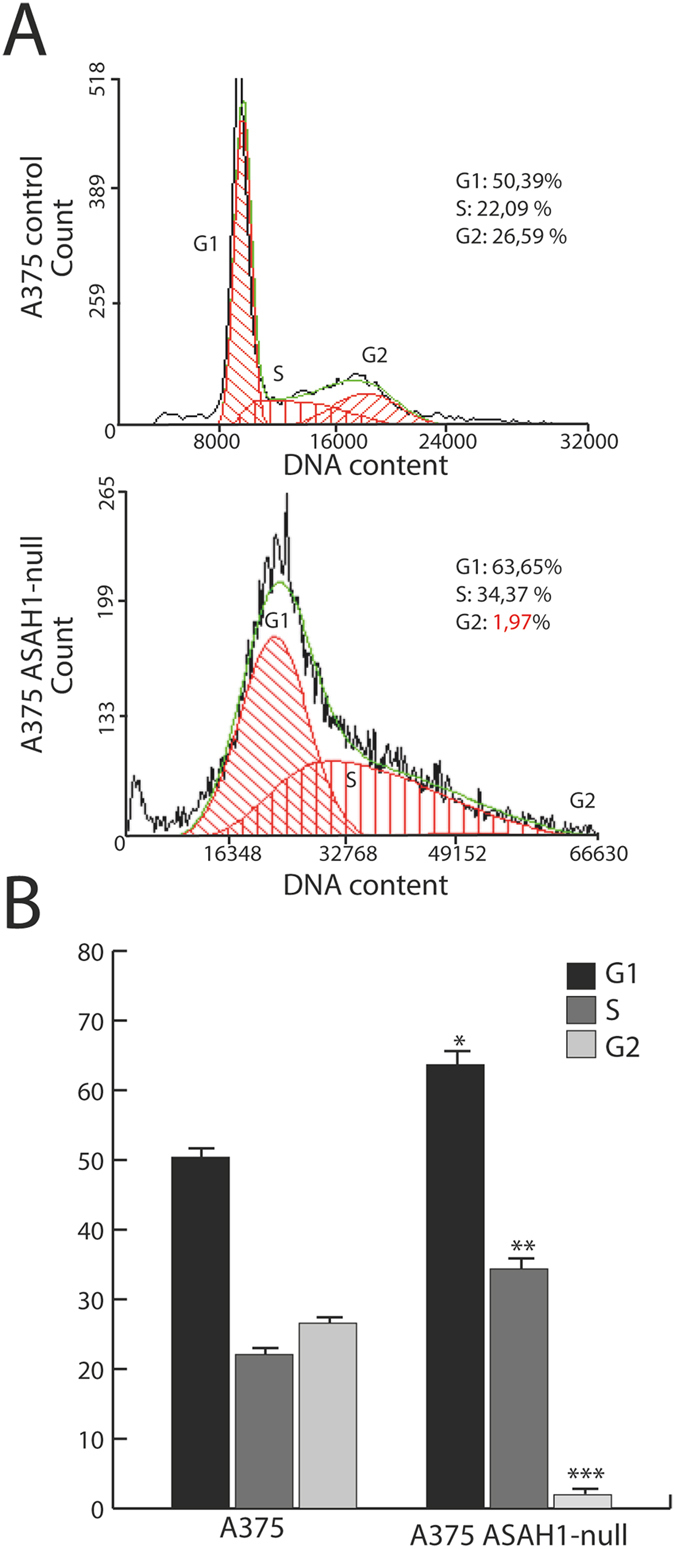
Figure 3.

AC deletion stops G1-S cell cycle progression. (A) Cell cycle progression was assessed using propidium iodide and flow cytometry analysis. Dot plots show different distribution between G1, S and G2 phases in control (scramble-treated, top) versus ASAH1-null cells (bottom). (B) Statistical analysis of the cell cycle distribution was performed using the Student’s t test; *p < 0.05, ** p < 0,01,***p < 0.001,. Experiments were performed 17 days after CRISPR/Cas9 ablation.
