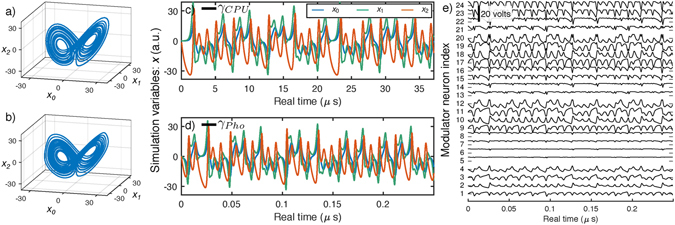
Figure 4.

Photonic CTRNN benchmarking against a CPU. (a,b) Phase diagrams of the Lorenz attractor simulated by a conventional CPU (a) and a photonic CTRNN (b). (c,d) Time traces of simulation variables for a conventional CPU (c) and a photonic CTRNN (d). The horizontal axes are labeled in physical real time, and cover equal intervals of virtual simulation time, as benchmarked by γ CPU and γ Pho. The ratio of real-time values of γ’s indicates a 294-fold acceleration. (e) Time traces of modulator voltages s i (minor y-axis) for each modulator neuron i (major y-axis) in the photonic CTRNN. The simulation variables, x, in (d) are linear decodings of physical variables, s, in (e).
