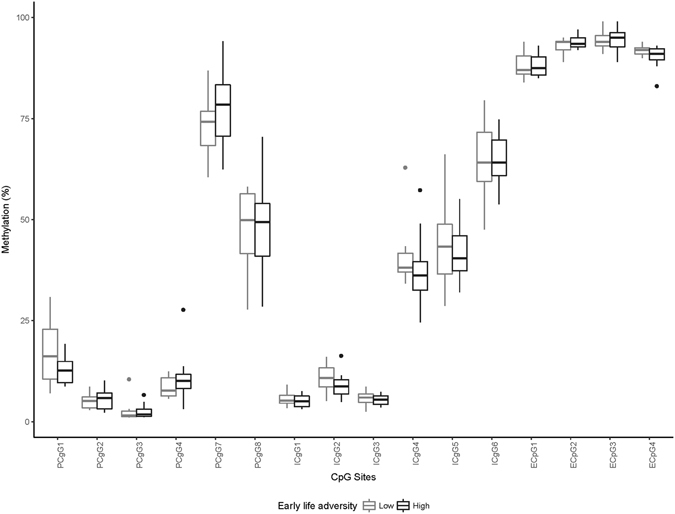
Figure 2.

OXTR Methylation as a Function of ELA Exposure in Males. *Represents statistically significant ELA group differences at p < 0.05; **represents statistically significant difference after a Bonferonni correction where p < 0.003.

OXTR Methylation as a Function of ELA Exposure in Males. *Represents statistically significant ELA group differences at p < 0.05; **represents statistically significant difference after a Bonferonni correction where p < 0.003.