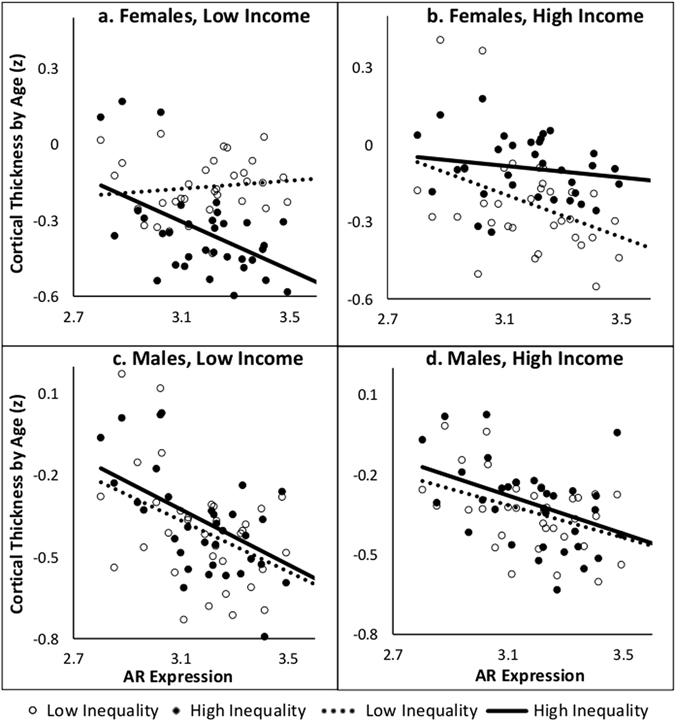
Figure 3.

The y-axis (Cortical Thickness by Age) is the Fisher z-transformed correlation coefficients of cortical thickness and age in each of the 34 regions. The x-axis is the AR expression in each of these regions. For each subgroup, there are 34 points representing each cortical region. Each male and female income subgroups are divided into high (solid circle, solid line) and low (hollow circle, dashed line) inequality subgroups. An inequality by AR expression interaction was analyzed for each income group.
