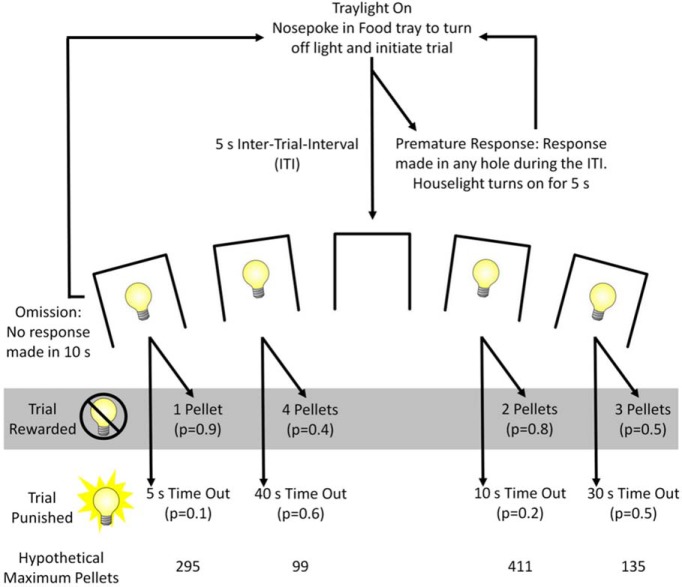
Figure 1.
Task schematic of the rGT. A nose poke response in the food tray extinguished the traylight and initiated a new trial. After an ITI of 5 s, four stimulus lights were turned on in holes 1, 2, 4, and 5, each of which was associated with a different number of sugar pellets (one to four pellets, labeled P1-P4). The animal was required to respond at a hole within 10 s. This response was then rewarded or punished depending on the reinforcement schedule for that option (indicated by the probability of a win or loss in brackets). If the animal was rewarded, the stimulus lights turned off and reward was delivered. If the animal “lost,” the stimulus light in the chosen hole flashed at a frequency of 0.5 Hz for the duration of the punishing timeout, and all other lights were extinguished. The order of the options from left to right was counterbalanced across the cohort (version A as shown, version B: 4, 1, 3, 2). The maximum number of pellets available per 30-min session shows that P1 and P2 were better than P3 and P4. The percentage choice of the different options was the primary dependent variable. A score variable was also calculated, as for the IGT, to determine the overall level of risky choice as follows: [(P1 + P2) – (P3 + P4)]. A negative score indicated a preference for the risky options, and rats were categorized as optimal decision-makers or risk-preferring rats accordingly. Adapted with permission from Barrus et al. (2015).

