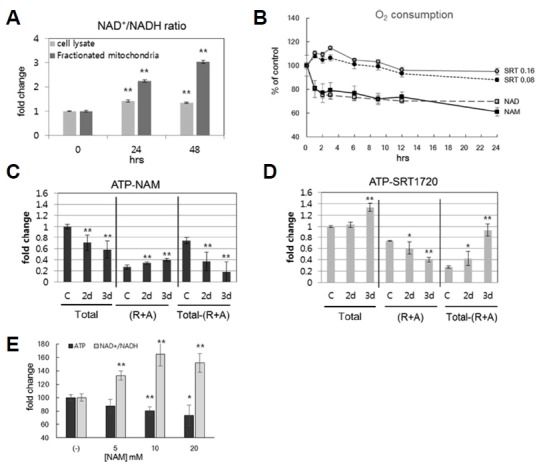
Fig. 4. Different effects of NAM and SRT1720 on mitochondrial activities.

(A) Fibroblasts were incubated for 1 or 2 d in the presence of 5 mM NAM, collected, and fractionated for cytosol (light bar) and mitochondria (dark bar). Each group was then analyzed for NAD+/NADH ratio, using an assay kit. (B) Fibroblasts were incubated on an XF24 culture plate, in the presence of 5 mM NAM, 5 mM NAD+, or [0.08 or 0.16] μM SRT1720; at the indicated time points, cells were subjected to analysis for O2 consumption rates in an XF24 analyzer. For each treatment, measurements of four different biological samples were taken, and the means were plotted. All changes in samples treated with chemicals, as compared to the Hour 0 control group, were with P < 0.05 (except for the later time points of SRT1720 treatments). (C and D) Fibroblasts incubated in the presence of 5 mM NAM (C) or 0.16 μM SRT1720 (D) were collected at the indicated time points. The same number of cells were lysed, and ATP contents were determined using an assay kit. To estimate mitochondrial ATP production, the amount of total ATP was subtracted by that in cells treated with 1 μM rotenone and 1 μM antimycin A for 1 h before cell collection (R+A). The resulting difference was presented as mitochondrial ATP production (Total - [R+A]). For each time point, six independent biological samples were analyzed, and the averages normalized by those of untreated cells (C) were plotted. *P < 0.1, **P < 0.05 (compared to Day 0 control, one-way ANOVA). (E) Cells were treated with 5, 10, or 20 mM NAM for 48 h; cells were then divided into two groups, and each was subjected to a determination of either total cellular ATP levels or the NAD+/NADH ratio. In experiments (A) and (E), three independent biological samples were analyzed, and the averages normalized by those of untreated cells were plotted. *P < 0.05, **P < 0.01 (compared with Day 0 control, one-way ANOVA).
