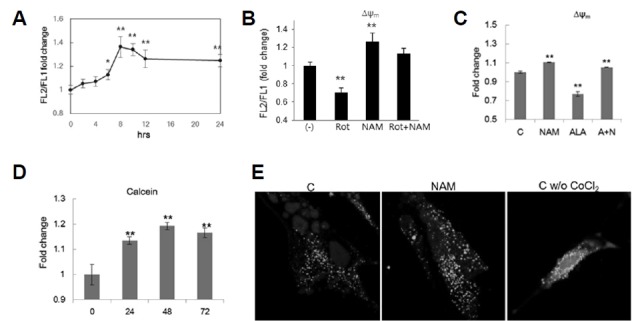
Fig. 5. Δψm increase and mPTP closure by NAM treatment.

(A) Fibroblasts incubated in the presence of 5 mM NAM were collected at the indicated time points, stained with JC-1, and Δψm was determined. Values relative to those of untreated cells (0 h) were plotted. (B) Fibroblasts were incubated in the presence or absence of 5 mM NAM for 24 h. To these cell cultures, 1 μM rotenone (Rot, Rot+NAM) were added for 1 h before cells were collected for the determination of Δψm. (C) Fibroblasts were incubated for 24 h in the presence of 5 mM NAM, 1 mM ALA, or both NAM and ALA (A+N) (ALA was treated during the final 4 h before collection), and then subjected to Δψm determination. (D) and (E) Cells were incubated in the presence of 5 mM NAM for 1, 2, and 3 days, and stained with 1 μM calcein AM for 30 min. After further incubation in the presence of 1 mM CoCl2 for 10 min, cells were subjected to flow cytometry to measure calcein fluorescence. For confocal microscopy of cellular calcein (E), cells were incubated in the absence or presence of NAM on a coverslip, and were then examined in confocal microscope after 24 h. Note: green puncta are larger and more abundant in NAM-treated cells. Without CoCl2, a large amount of calcein fluorescence was found in smear in cytosol. In all experiments, three independent biological samples were analyzed, and the averages normalized by those of untreated cells were plotted. *P < 0.05, **P < 0.01 (compared with Day 0 control, one-way ANOVA).
