Fig. 5.
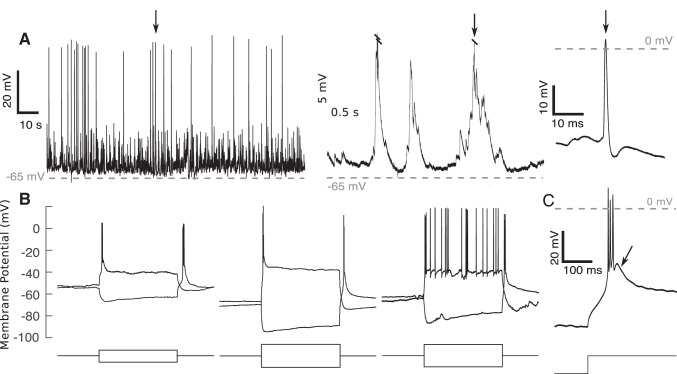
Neurons recorded in whole cell configuration were of good quality. A: example of spontaneous activity from a neuron recorded 3.2 mm below the pial surface with detail of spontaneous burst (arrow indicates burst shown in detail on right). B: example whole cell traces recorded in the thalamus for 3 different neurons. Note the sag in membrane potential following hyperpolarizing current injection (representing activity of Ih, as described in Leist et al. 2016) and afterhyperpolarization rebound bursting in each trace, indicative of thalamic neurons. Current injections lasted 0.5 s and ranged from ±50 pA (1st recording) to ±100 pA (2nd and 3rd recordings). C: after hyperpolarizing current injection, rebound bursts exhibited afterdepolarization (see arrow, consistent with ventrobasal thalamic nucleus cells; Wang et al. 2010b). Current injection was −150 pA.

