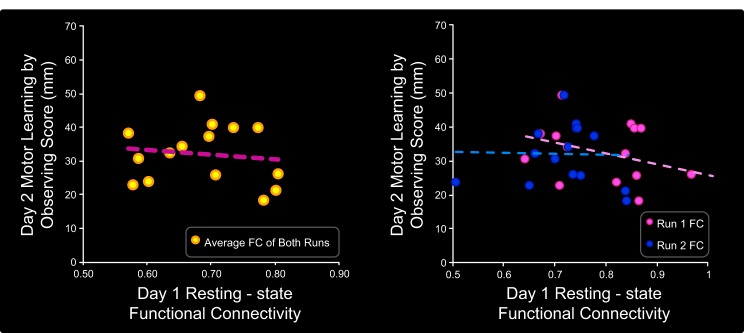
Fig. 5.
Preobservation FC did not predict motor learning by observing scores for the control group. As was the case with the learning group, subjects in the control group exhibited preobservation (day 1) resting-state FC between the left S1 ROI and clusters in bilateral PMd, M1, and S1 and left SPL (not shown). FC values reflect the Fisher Z-transformed temporal correlation between the ROI time series and the average time series of all clusters in the identified network. Across subjects in the control group, there was no correlation between day 1 resting-state FC within this network and day 2 motor learning by observing scores. This was the case when both runs were analyzed together (r = −0.38, P = 0.15; shown in scatterplot on left) as well as when the runs were analyzed separately (r = −0.03, P = 0.91; shown in scatterplot on right).

