Fig. 2.
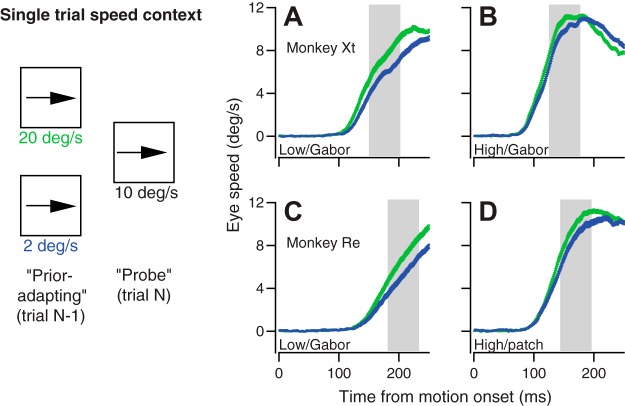
Single-trial speed prior paradigm and examples of the trial-over-trial effect of the speed of the previous target motion on the initiation of pursuit. Left: diagram shows pairs of consecutive trials used to adapt and probe priors for target speed. The experimental design provided a sequence of prior-adapting and probe trials where the probe speed always was 10°/s. A–D: each graph shows trial-averaged eye speed traces in response to the 10°/s probe trials. Green and blue traces show probe trials that were preceded by prior-adapting trials that presented target motion at 20 vs. 2°/s. Error bands represent SE. The gray shaded regions represent the time points where eye speed was averaged for further analysis, from 50 to 100 ms after the initiation of pursuit. In A and B, the stimuli were a low- and high-contrast grating, respectively, for monkey Xt. In C and D, the stimuli were a low-contrast Gabor and high-contrast patch of dots, respectively, for monkey Re.

