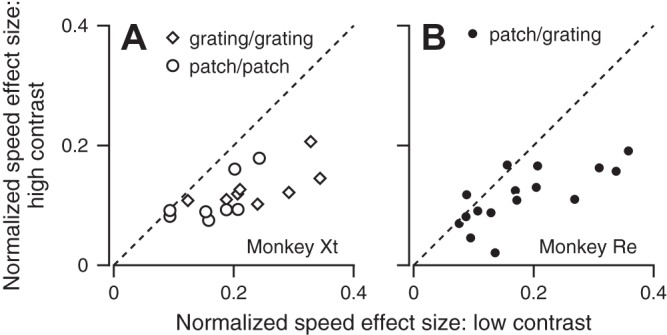
Fig. 3.

Effect of stimulus contrast on the size of the single-trial effect of the previous target motion’s speed. In both graphs, each symbol plots the mean size of the effect of the prior-adapting trial on the speed of the response to a high- vs. low-contrast stimulus. Different symbols show data for different experiments. In A, the high- and low-contrast targets were matched in form, and different symbols show responses for the two different stimulus forms. In B, the high- and low-contrast targets were a patch of dots and grating, respectively.
