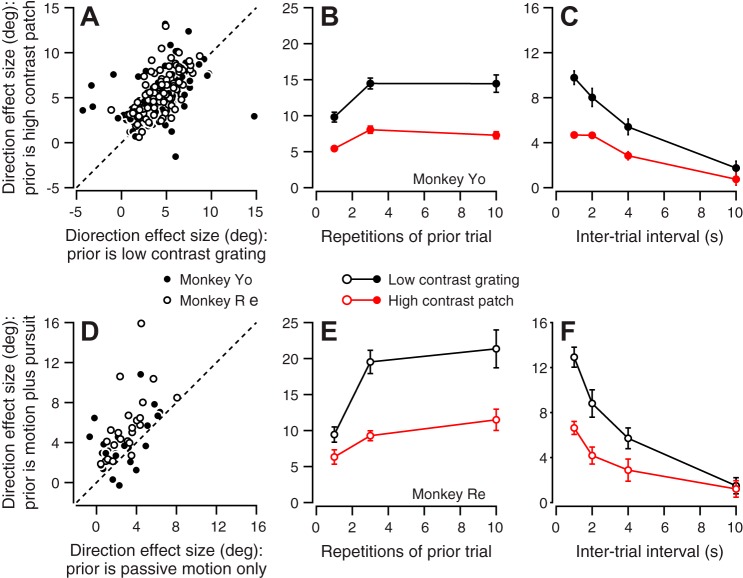
Fig. 8.
Effect of the qualities of the stimulus in prior-adapting trials on the size of the directional effect. A: symbols plot the mean direction effect size when the prior-adapting trial was a low-contrast grating vs. a high-contrast patch. Each symbol shows data for a different combination of prior-adapting and probe directions: each experiment provided 3 symbols. Open and solid symbols show data from monkeys Re and Yo, respectively. B and E: symbols show the mean direction effect size for different number of prior-adapting trial repetitions. C and F: symbols show the mean direction effect size as a function of the duration of the intertrial interval between the prior-adapting and probe trials. B and C contain data from monkey Yo. E and F contain data from monkey Re. Red and black symbols show effects for high- and low-contrast targets, respectively. Error bars represent SE. D: symbols plot the mean direction effect when the prior-adapting trial consisted of active pursuit vs. 100 ms of passive visual motion. Open and solid symbols show data from monkeys Re and Yo, respectively.

