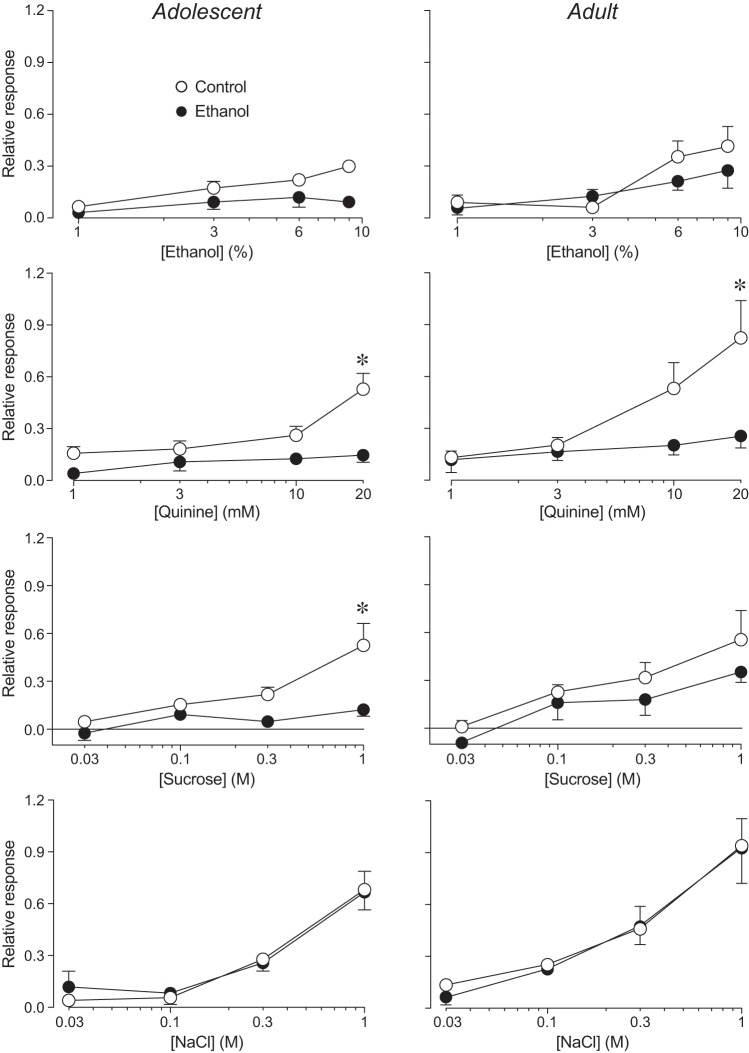
Fig. 4.
Glossopharyngeal (GL) nerve responses of adolescent (left) and adult (right) rats to lingual stimulation with 4 concentrations of ethanol, quinine, sucrose, and NaCl. Within each panel, we juxtapose relative responses of control and ethanol rats. Relative responses (mean ± SE) reflect the ratio of the integrated response to a taste stimulus divided by that to 0.5 M NH4Cl. We obtained GL nerve responses from 16 adolescent (8 control and 8 ethanol) and 13 adult (6 control and 7 ethanol) rats. We show analyses of these responses in Table 2. When there was a significant main effect of maternal diet (or interaction of maternal diet × age class) for a given stimulus, we compared relative response to each concentration across control and ethanol rats (separately for each age class), using Sidak’s multiple comparison test (*P < 0.05).

