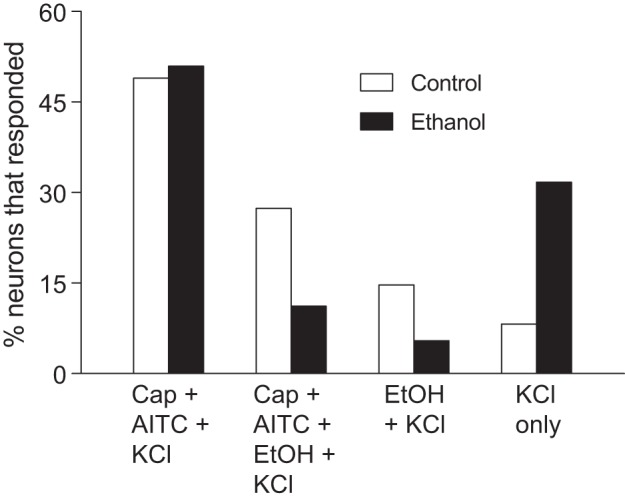
Fig. 6.

Percentage of TG neurons from control (n = 134 cells) vs. ethanol (n = 178 cells) rats that responded to 1) capsaicin (Cap) + AITC + KCl, 2) Cap + AITC + ethanol (EtOH) + KCl, 3) EtOH + KCl, or 4) KCl only. There was a significant association between the number of neurons in each response category and maternal diet (χ2 value = 38.1, df = 3, P < 0.0001).
