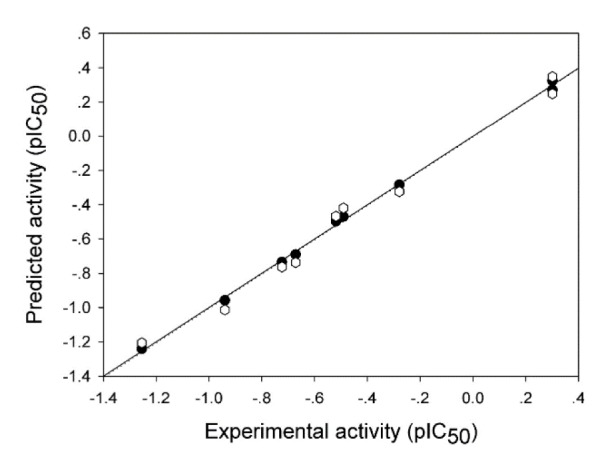
Figure 4. Plot of experimental versus predicted pIC50 values of aromatase inhibitory activity of the tested compounds generated by the QSAR model (training set: compounds are represented by filled circles, and the regression line is shown as a solid line; leave-one-out validated testing set: compounds are represented by open hexes, and the regression line is shown as a dotted line).

