
Fig. 3.
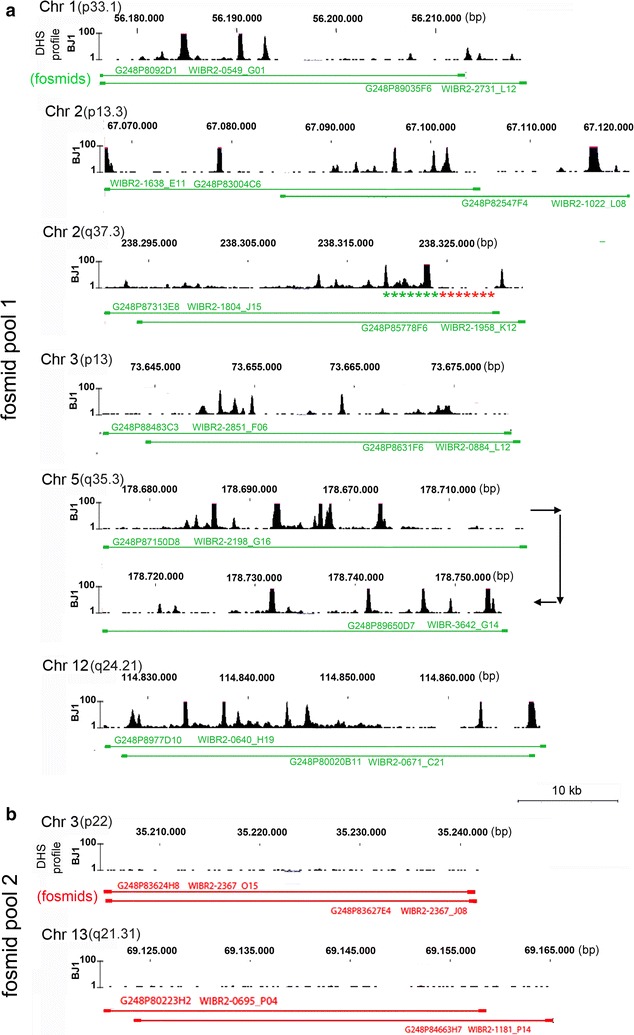
DHS profiles of targeted genomic regions representing DHS[+] or DHS[−] sites on different chromosomes in BJ1 nuclei and fosmid clones used for their delineation by 3D-FISH. a Selected regions with interspersed clusters of DHS[+] sites, DHS profiles shown in black (browser shots adopted from http://encodeproject.org/). Genomic position and assignment to DHS profiles of fosmid clones used in fosmid pool 1 are indicated by green lines. b Selected regions representing DHS[−] sites, DHS profiles shown in black (browser shots adopted from http://encodeproject.org/). Genomic position and assignment to DHS profiles of fosmid clones used in fosmid pool 2 are indicated by red lines. Using pairs of (partially) overlapping clones for both fosmid pools ensures optimal hybridization efficiency. Asterisks mark the approximate location of probes described in Fig. 5