Fig. 2.

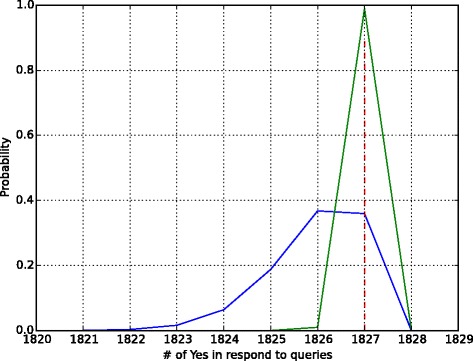
Risk analysis of data in any genomic dataset. The green line represents the responds of the beacon service when the query individual being in beacon database while the black one represents them not being there. The red line denotes the

Risk analysis of data in any genomic dataset. The green line represents the responds of the beacon service when the query individual being in beacon database while the black one represents them not being there. The red line denotes the