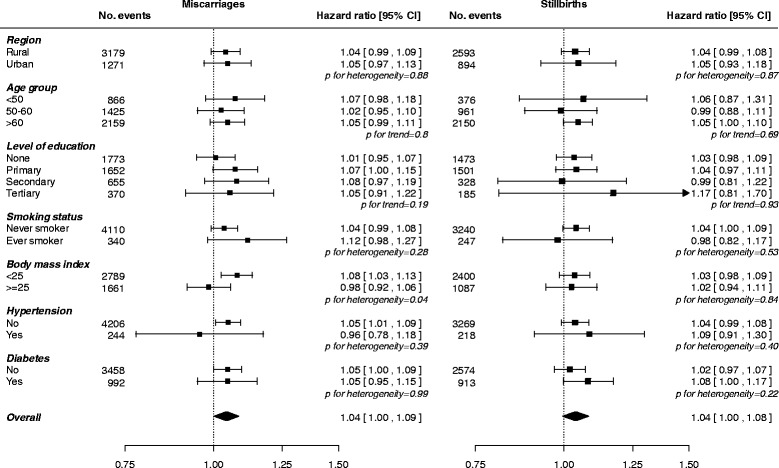
Fig. 3.

Adjusted hazard ratios for incident circulatory disease per additional miscarriage (left) and stillbirth (right) by baseline characteristics. Adjustments are as in Table 2. Each square has an area inversely proportional to the standard error of the log risk. The diamond indicates the overall risk of circulatory disease per additional miscarriage and stillbirth and its 95% CI. Analyses for miscarriage and stillbirth, respectively, are among women with at least one miscarriage or at least one stillbirth
