
Fig. 3.
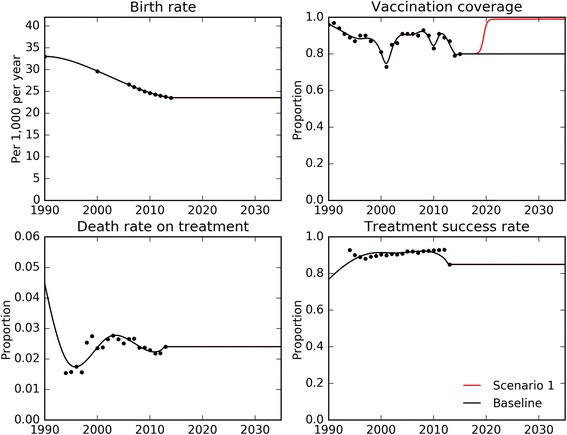
Fitting of time-variant parameters to data. Black dots, loaded data for the Philippines from – World Bank (birth rate), UNICEF (vaccination coverage) and Global TB Report (death rate on treatment and treatment success rate). Solid lines, time-variant parameter functions – black, baseline scenario; red, example scenario of scale-up of vaccination coverage