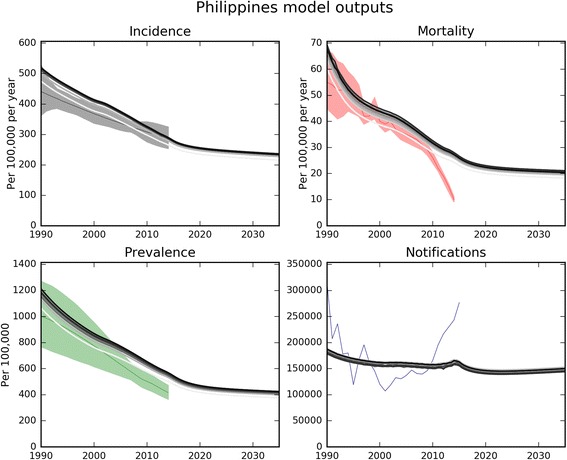
Fig. 4.

Visual outputs from model calibration to data for epidemiological indicators. Data are from Global TB Report 2016 for the Philippines. Progressively darker parallel grey lines, successive model runs accepted by the Metropolis-Hastings algorithm; coloured shaded areas (where presented), calibration data uncertainty ranges; thin central coloured lines in shaded areas, calibration data point-estimates. This example calibration is to reported incidence data from 1990 to 2016 with weighting to emphasise calibration to more recent years for which data are available, with three uncertainty parameters (effective contact rate, duration of untreated TB, case-fatality of untreated TB), with values starting from values found during a manual calibration
