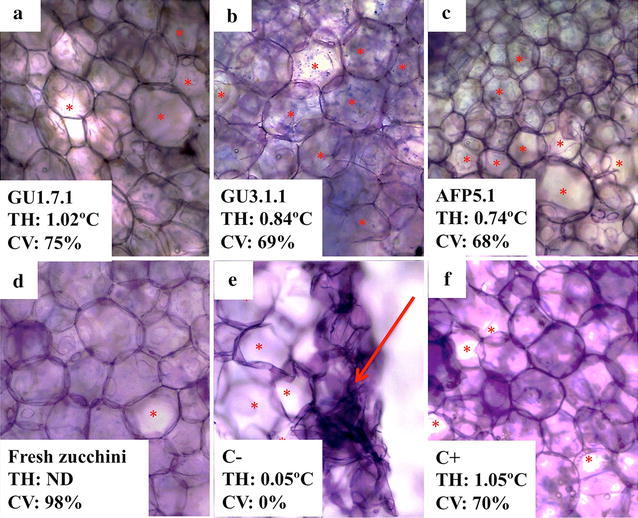
Fig. 2.

Effect of AFPs from GU1.7.1 (a), GU3.1.1 (b) and AFP5.1 (c) on zucchini. Negative (C−, e) and positive (C+, f) controls correspond to samples treated with buffer and a commercial AFP, respectively. Plant cells were stained with TBO. TH of AFPs from Antarctic isolates and plant cell viability (CV), determined by NR staining, are indicated in each image. A fresh zucchini sample (d) was included in order to compare results. Red asterisks represent small holes formed from small ice crystal; meanwhile, red arrows indicate high cellular damage product of cellular disruption due to the presence of big ice crystals. ND not determined
