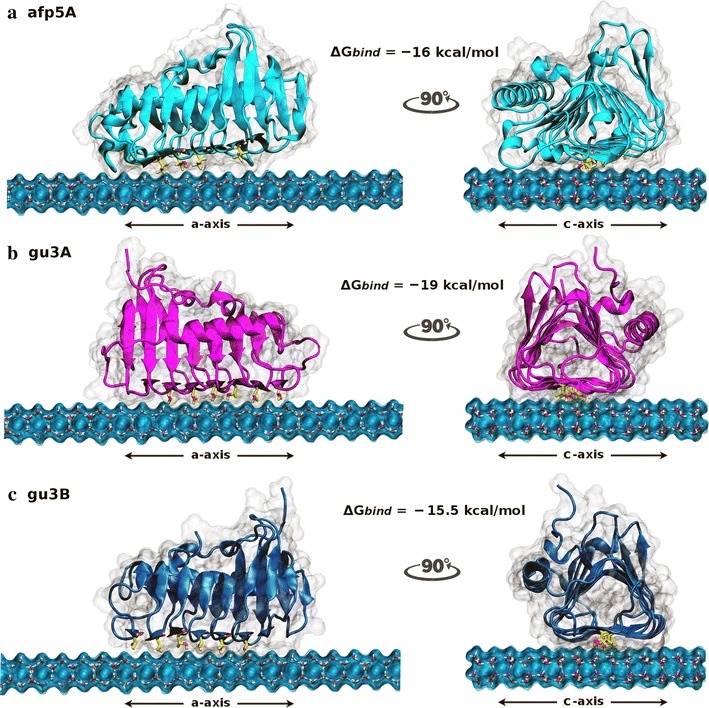
Fig. 4.

Side views of the final docking orientations of afp5A (a), gu3A (b) y gu3B (c). a-Axis view (left) and c-axis (right) of the docked conformations of AFPs over the primary prism plane of ice. Docking binding energies obtained are shown for each protein. Regularly spaced threonine residues in the ice-binding surface of the proteins are shown in yellow. All docking simulations were performed with Autodock Vina. All images were generated with VMD
