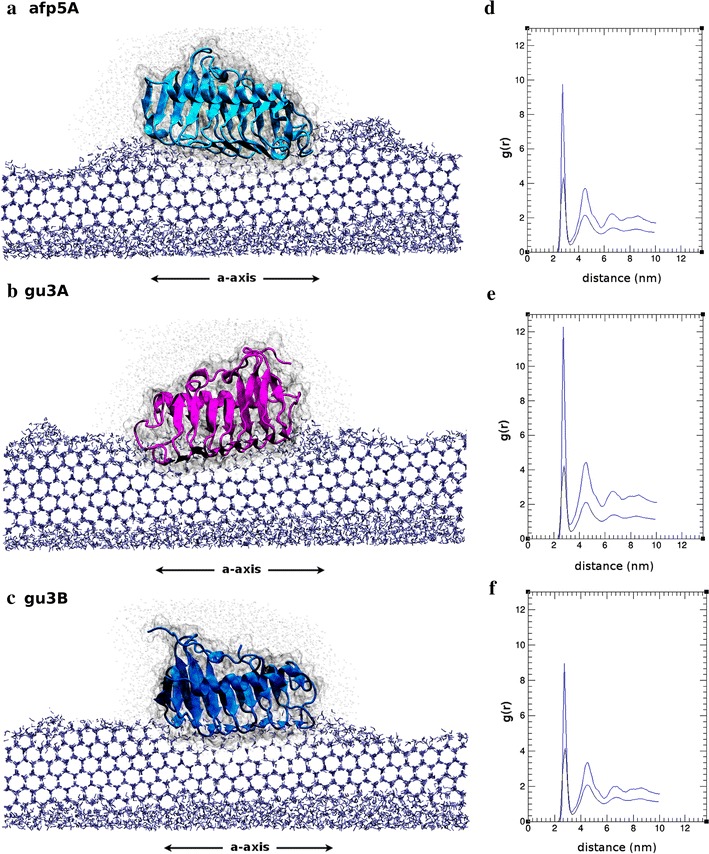
Fig. 5.

Front view (a-axis) of simulated AFPs afp5A (a), gu3A (b), gu3B (c) and the corresponding oxygen–oxygen radial distribution functions (d–f). In RDF graphs blue lines correspond to g(r) distribution calculated at the end (150 ns) of each simulation whilst the black lines correspond to the same function calculated at the start of molecular dynamics simulations. Simulations were carried out using NAMD software. All images were generated using VMD
