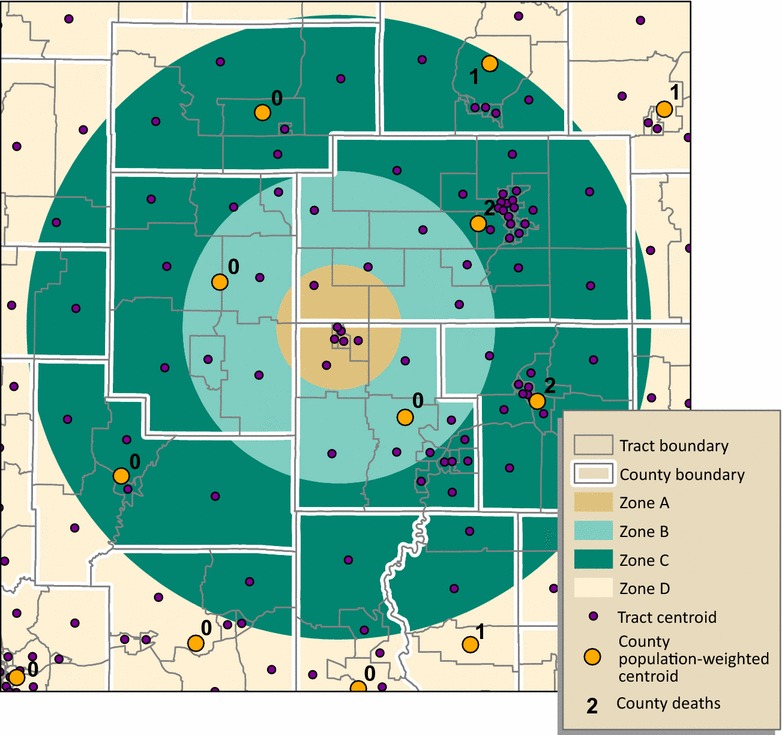
Fig. 4.

Population-weighted centroid assignment. Each tract centroid is attributed the population of interest. County centroids are placed using the mean center of tract centroids weighted by the tract population. Mortality counts for centroids falling within each study zone are summed to estimate mortality by zone. Results for zones A and B in this example, zero deaths for both, are the same as those for geographic centroid assignment. Zone C is assigned five deaths because the centroid in the northeast, with a value of “1,” is now positioned within zone C
