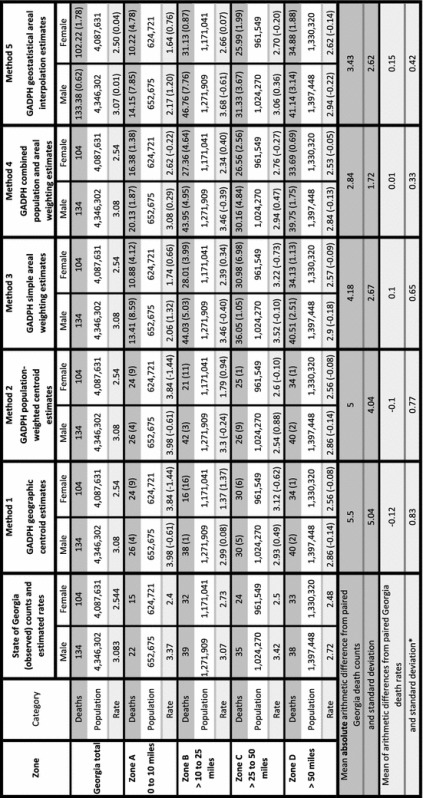
Table 2.
Comparisons between observed 1999–2011 Georgia adolescent cancer mortality and estimated mortality, by method and zone

Rate per 100,000 per year
1999–2011 person-year population estimated using simple areal weighting with 2000 and 2010 tract-level source zones, then weighted by year
Methods 3 through 5 use death estimates expressed as real numbers, in contrast to the centroid methods which use integer counts
Value in parentheses is the arithmetic difference between the estimate and its paired state of Georgia value
We use absolute arithmetic differences for death counts because if we used actual differences, the mean difference would equal 0
*Standard deviations of the mean arithmetic difference from paired Georgia deaths rates are distinct from those shown on Fig. 7, which are standard deviations of the mean of the paired rates
