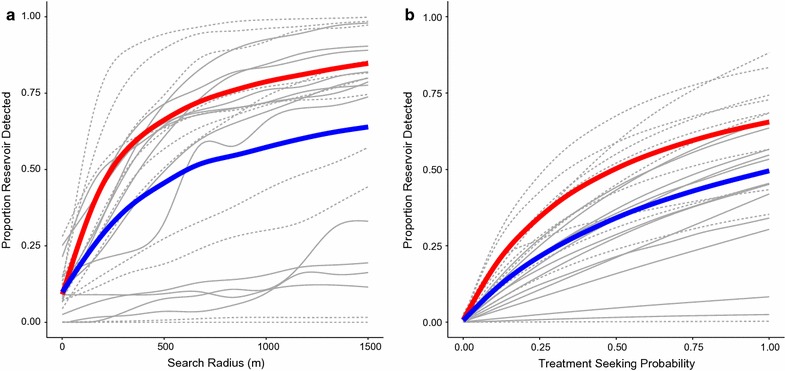
Fig. 4.

Reservoir detected vs. search radius and treatment seeking probability. a Proportion of reservoir detected vs. search radius. Treatment seeking is not simulated and is based on the data. b Proportion of reservoir detected vs. treatment seeking probability. Treatment seeking behavior is simulated amongst those reporting fever. Red line population aggregate, solid gray lines catchment areas with prevalence below the median (92/1000), dashed gray lines catchment areas with prevalence above the median (92/1000), blue line average over catchment areas. Field test sensitivity = 0.95, field test specificity = 0.80, P (treatment seeker is tested) = 0.90, P (RCD-selected household is covered) = 0.90, P (individual within RCD-selected household is covered) = 0.90
