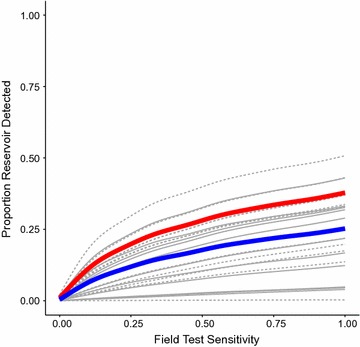
Fig. 7.

Proportion of reservoir detected vs. field test sensitivity. Red line population aggregate, solid grey lines catchment areas with prevalence below the median (92/1000), dashed grey lines catchment areas with prevalence above the median (92/1000), blue line average over catchment areas. Treatment seeking behavior sourced from data, search radius = 100m; field test specificity = 0.80; P (treatment seeker is tested) = 0.90; P (RCD-selected household is covered) = 0.90; P (individual within RCD-selected household is covered) = 0.90
