Fig. 4.

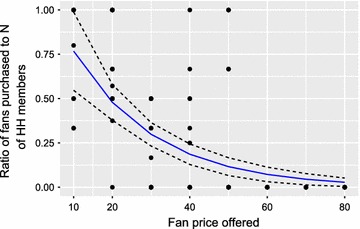
Total demand for ‘Bɔkɔɔ’ net fan vs. drawn price per unit. Slope estimated with Poisson regression, 95% C.I. for regression result shown with dotted lines. N number, HH household

Total demand for ‘Bɔkɔɔ’ net fan vs. drawn price per unit. Slope estimated with Poisson regression, 95% C.I. for regression result shown with dotted lines. N number, HH household