Fig. 10.

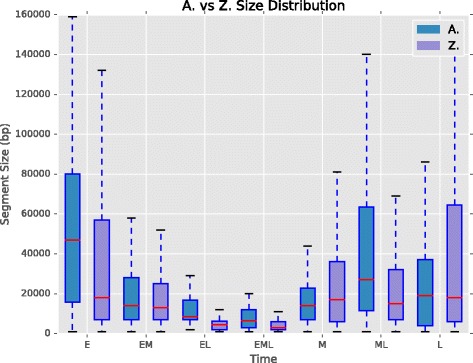
Segment size distribution. Boxplots for every combination of replication time, illustrating the distribution of segment sizes. Early (E) and mid-late (ML) S were largest in A. thaliana, while early and late (L) were largest in Z. mays

Segment size distribution. Boxplots for every combination of replication time, illustrating the distribution of segment sizes. Early (E) and mid-late (ML) S were largest in A. thaliana, while early and late (L) were largest in Z. mays