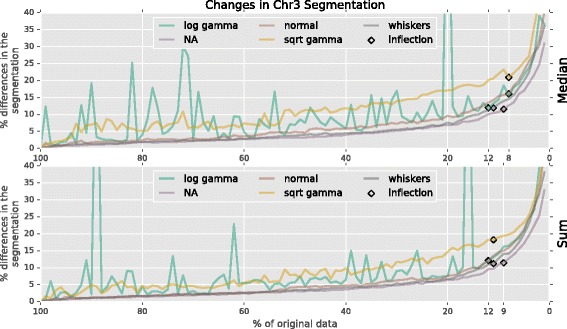
Fig. 11.

Segmentation differences in downsampled data. After downsampling the A. thaliana data, the accuracy of median (top) and sum (bottom) aggregation, and outlier detection using log gamma, none (NA), normal, square root gamma, and whiskers. Inflection points in the differences are labeled with black diamonds
