Fig. 1.
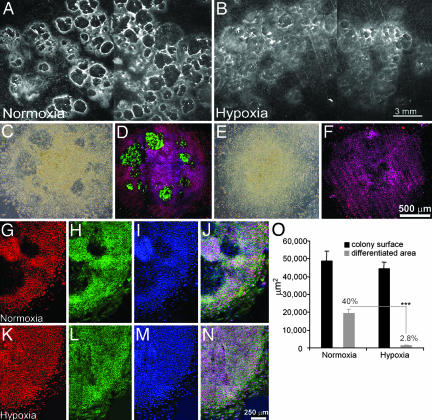
Differentiation of H1 cell colonies cultured under normoxic or hypoxic conditions. (A and B) H1 cells (passage 30) were cultured on MEF feeder cells under normoxic (A) or hypoxic (5% O2)(B) conditions for 12 days and photographed under a stereomicroscope. Differentiated areas appear dark and are surrounded by bright rings. (Bar, 3 mm.) (C-F) H1 cell colonies (passage 36) grown on Matrigel-coated, feeder-free coverslips are shown after culture under normoxic (21% O2)(C and D) or hypoxic conditions (4% O2)(E and F). (C and E) Phase contrast images. Under phase contrast, differentiated areas containing the larger, flatter cells appear darker than the areas occupied by undifferentiated ES cells. (D and F) The colonies have been immunostained for SSEA-1 (green) and Oct-4 (red). Nuclei are colored blue. SSEA-1-positive cells are confined to areas of differentiation, which are not evident in the cells grown under hypoxia. Note the lack of overlap of SSEA-1 and Oct-4 staining. (Bar, 500 μm.) (G-I) Cells cultured as above under normoxia were immunostained for Oct-4 (red) (G), SSEA-4 (green) (H), and TO-PRO-3 (blue) (I) to stain nuclei. (J) The colocalization of Oct-4 and SSEA-4 staining and the absence of both antigens in the differentiated areas. (K-N) Colonies grown under hypoxia and stained as in G-J. (Bar, 250 μm.) (O) Morphometric analysis of differentiated areas within H1 colonies (passage 30) after growth for 12 days under either normoxic or hypoxic (5% O2) conditions. Data for each condition were obtained from the analysis of 15 colonies randomly sampled from three independent culture wells. The graph compares total colony area (black bars) with the overt differentiation area (gray bars). ***, P < 0.0001.

