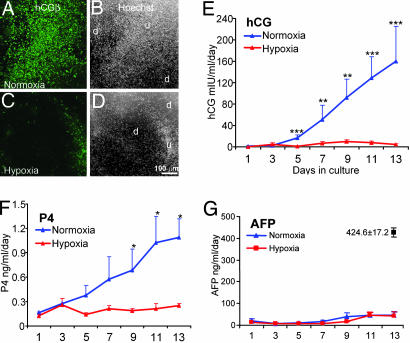
Fig. 3.
Differentiation of hES cell colonies as determined by immunohistochemical and biochemical analysis. (A-D) Detection of hCGβ by immunofluorescence (green) (A and C) and of nuclei by Hoechst 33258 (white) (B and D) in the H1 cells cultured under normoxic (A and B) or hypoxic (C and D) conditions for 12 days. The photographs encompass areas of overt differentiation (d), which have fewer nuclei and, hence, show less fluorescence with Hoechst dye than the areas appearing undifferentiated (u). CGβ signals (green) (A and C) are largely confined to cells in the “transition zone” between the overtly differentiated areas and the more uniform, undifferentiated areas. (Bar, 100 μm.) (E) The mean daily production of hCG by H1 cells from five independent experiments carried out at passages 30, 31, 32, 36, and 50 under normoxic or hypoxic culture. Values are means ± SEM for 15 independent determinations (n = 3 for each experiment). Values that differ significantly are shown with asterisks (***, P < 0.001; **, P < 0.01; *, P < 0.05). (F) The mean daily production of P4 from four wells in two independent experiments (passages 30 and 31). Values that differ significantly (P < 0.05) are shown with an asterisk. (G) The mean daily production of AFP from the same five independent experiments described in E. No significant differences were observed between normoxic and hypoxic conditions on any of the days of culture, and the production levels were much lower than those observed in H9 cells (1) as indicated (▪).

