Fig. 1.
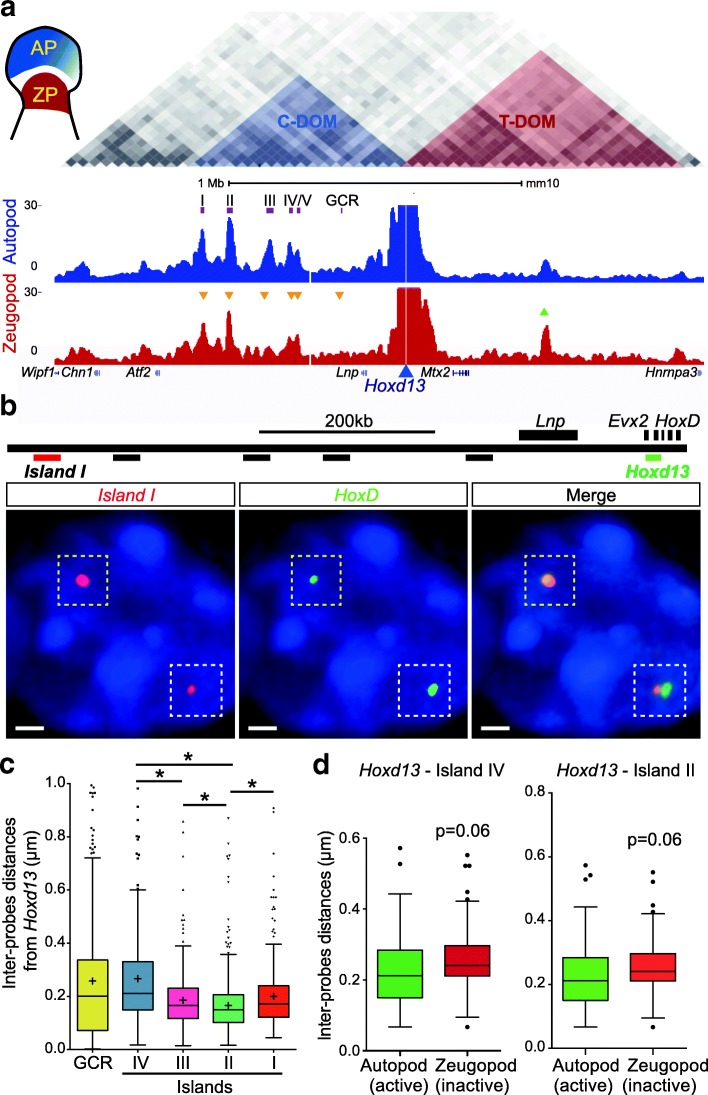
Interactions at the HoxD locus as seen by 3D DNA FISH and 4C-seq. a 4C interaction profiles (normalized signals) of Hoxd13 in wild-type autopod (AP, blue) and zeugopod (ZP, red) cells, isolated from E12.5 embryonic mouse forelimb. The position of the TADs is highlighted on top (data from [9]). The triangles indicate statistically significant increases (green) or decreases (orange) in contacts on the main 4C peaks (p < 0.0001 using Wilcoxon rank test). b Positions of fosmid probes used for 3D DNA FISH. The images below show the FISH signals obtained for Hoxd13 (green) and island I (red) as an example of both tightly associated signals (upper left allele, yellow dashed square) and separated signals (lower right allele, white dashed square). Scale bar: 1 μm. c Quantification of inter-probe distances between Hoxd13 and the regulatory elements in autopods ranked left to right, from the closest to the furthest in terms of genomic distance. Kruskal–Wallis test was followed by Dunn’s multiple comparison tests: *p < 0.05. d 3D DNA FISH distances as measured in autopod (Hoxd13 active, green) and zeugopod (Hoxd13 inactive, red) cells from E12.5 mouse forelimbs. Both Tukey boxplot representations show shorter distances in those tissues where Hoxd13 is active (Mann–Whitney test)

