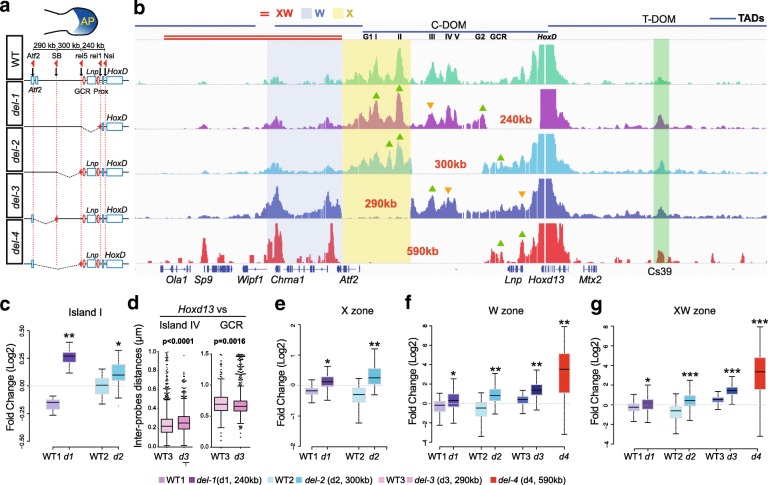
Fig. 5.
Reallocation of long-range contacts in reorganized TADs. a Forelimb bud with the autopod in blue is shown above the deletion series with the various positions of loxP site used to engineer the deletions (red arrowheads). b 4C interaction profiles from autopod cells with Hoxd13 as a bait in control (wild type (WT), green), del-1 (purple), del-2 (light blue), del-3 (dark blue), and del-4 (red). The four horizontal bars on top represent the TADs as taken from [9]. The position of the islands is indicated below the bar of C-DOM. The X zone is highlighted in yellow, the W zone is highlighted in blue, and the double red line on top indicates the XW zone. The triangles indicate statistically significant increases (green) or decreases (orange) in contacts (p < 0.05 using Dunn test using p value adjustment with the Benjamini–Hochberg procedure). c, e–g, The Y-axis represents a log2 scale. c Fold change on specific contacts as observed in b for island I. d Distance measurements from 3D DNA FISH between Hoxd13 and island IV (left) and GCR (right) in autopod cells from WT and del-3 specimens. e Fold change in “region X” (highlighted in yellow in panel b). f Fold change in the “W zone”, highlighted in blue and centromeric to all deletions. g Fold change in the “XW zone”, a 590-kb region (highlighted in red) containing the W zone and extending further centromeric to all four deletions. *p < 0.0001; **p < 10-30; ***p < 10-80 (compared with a Wilcoxon rank sum test)

