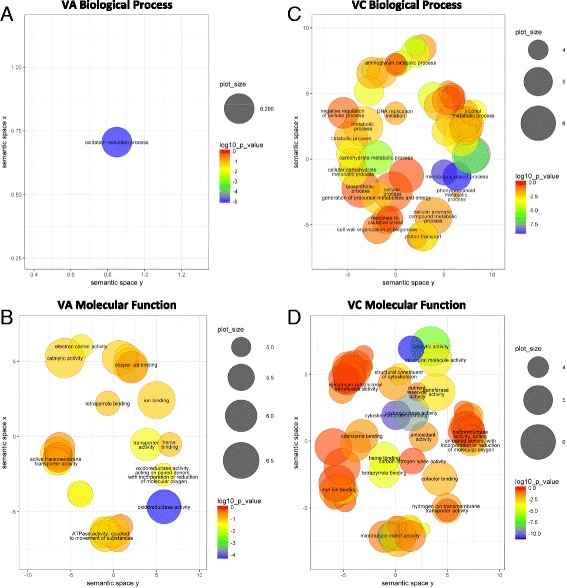
Fig. 5.

Plot of significant enriched GO terms in V. arboreum and V. corymbosum under pH stress. Enrichment was estimated for genes showing differential expression in V. arboreum (a, b) and V. corymbosum (c, d) in response to treatment pH 6.5 compared to control pH 4.5. Biological process (a, c) and molecular function (b, d) ontology terms were analyzed independently on AgriGO and terms below 0.05 FDR after Yekutieli multi-test adjustment were plotted using REVIGO as function of namespace. Each circle represents a significant GO term, with semantically similar terms placed closer together. Circle color indicates the p-value obtained from AgriGO and size of the circle corresponds to the occurrence of the term in the underlying data set (i.e. more general terms appear as larger circles). A single representative GO term label is provided for each cluster for clarity; this term is selected by most significant p-value. All terms can be found in Additional file 5: Table S3
