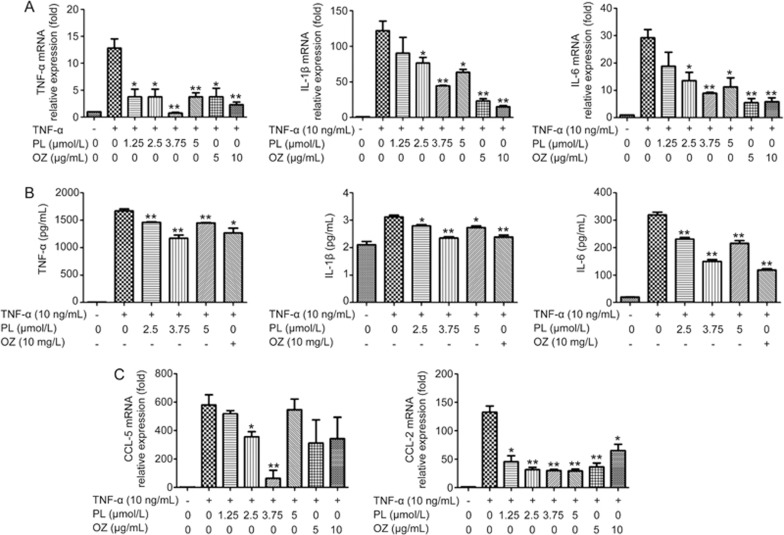
Figure 2.
The effects of PL and OZ on the TNF-α-induced PDLSCs. (A) TNF-α, IL-1β and IL-6 mRNAs were subjected to real-time PCR analysis after 24 h. The expression levels were normalized to that of β-actin. (B) The levels of TNF-α, IL-1β and IL-6 in the medium were measured using an ELISA kit. (C) The expressions of CCL-5 and CCL-2 mRNA were measured by real-time RT-PCR. The data are presented as the mean±SD. *P<0.05, **P<0.01 vs the (TNF-α”+”, PL”0”, OZ”0”) group. All data were obtained from at least three independent experiments.

