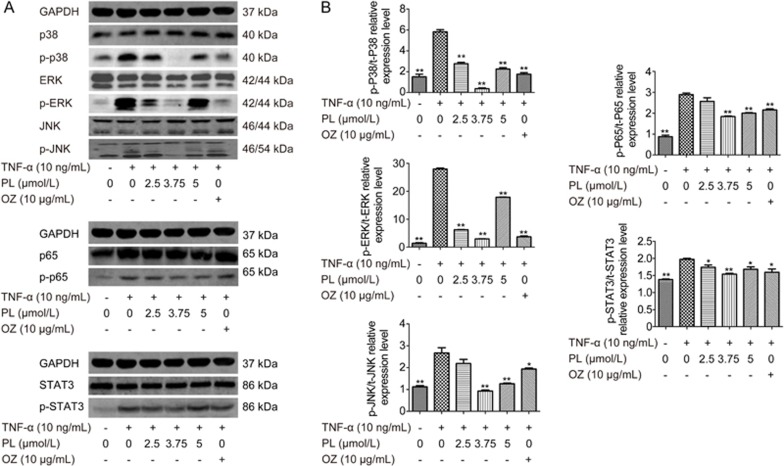
Figure 5.
The effects of PL and OZ on MAPK, NF-κB and JAK/STAT phosphorylation in TNF-α-induced PDLSCs. The cells were treated with 10 ng/mL of TNF-α and different concentration of PL (0, 2.5, 3.75 and 5 μmol/L) and OZ (10 μg/mL) for 24 h. (A) The levels of P38, ERK, JNK, p65 and STAT3 and phosphorylated p38, ERK, JNK, p65 and STAT3 were examined in whole-cell lysates via Western blotting. (B) The relative expression levels of p-p38/p38, p-ERK/ERK, p-JNK/JNK, p-p65/p65 and p-STAT3/STAT3 were calculated based on the analysis of the gray band intensities. The data are presented as the mean±SD. *P<0.05, **P<0.01 vs the (TNF-α”+”, PL”0”, OZ”0”) group. All data were obtained from at least three independent experiments.

