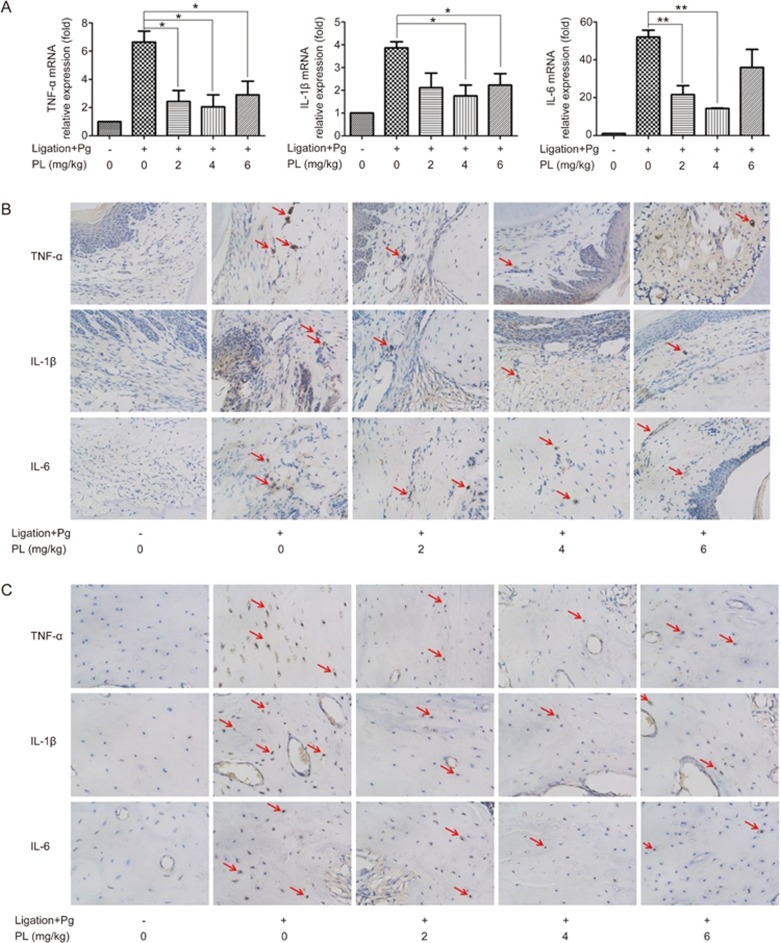
Figure 7.
TNF-α, IL-1β and IL-6 expression levels in SD rat model. (A) Real-time PCR analysis was done on SD rat gingiva. The expression levels were normalized to that of β-actin. The data are presented as the mean±SD. *P<0.05, **P<0.01. (B) Immunohistochemical staining images on periodontal ligament sites at 400× magnification. (C) Immunohistochemical staining images on alveolar bone sites at 400× magnification. Arrows represent the immunoreactive cells.

