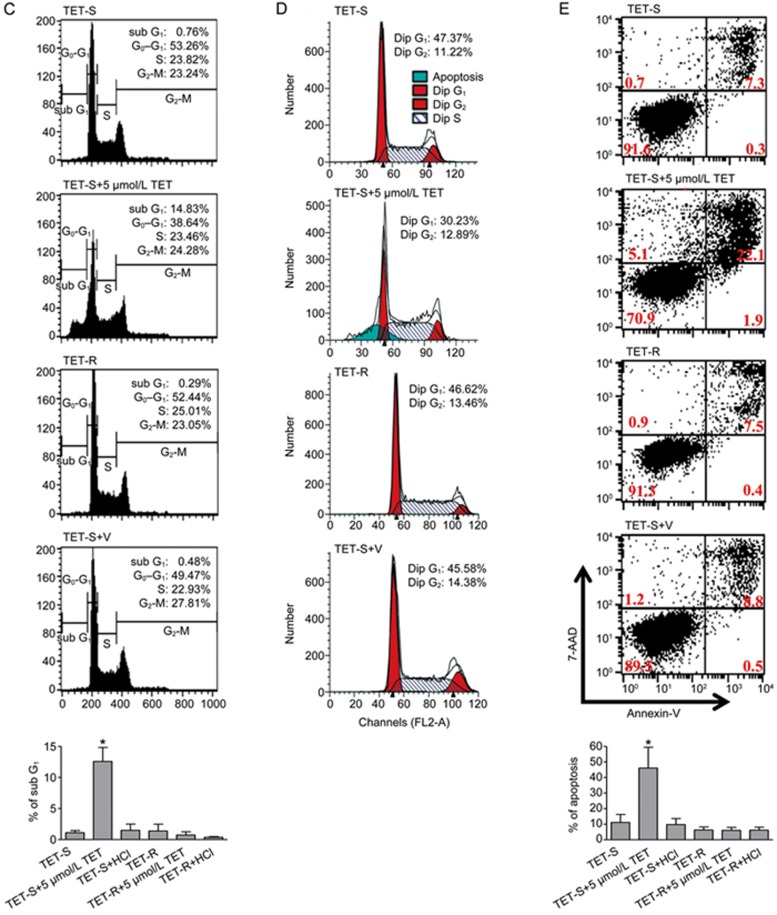
Figure 2C–2E.
Resistance to TET was higher, but proliferation was slower, in TET-resistant (TET-R) Jurkat cells. TET-R Jurkat cells resistant to 5 μmol/L TET were established as a model for investigating drug resistance. TET-R Jurkat cells (3×10⁵ cell/mL) incubated in a 96-well plate were subjected to higher concentrations of TET, as indicated, for 24 h. (C) After stained with propidium iodide, cell cycle distribution of the cells was analyzed using flow cytometry. The bars in the bottom diagram show the percentage (mean±SD, n=3) of the apoptotic cells in the sub-G1 phase. *P<0.05 vs control. (D) Cell cycle profiles were further analyzed using ModFit software. The sub-G1 peak (blue peak) indicates apoptotic cells. (E) Representative flow cytometric dot plots of cells stained with Annexin V and 7-AAD are shown. The bars in the bottom diagram display the percentage (mean±SD, n=3) of apoptotic cells in different groups. *P<0.05 vs control. Representative results from at least three independent experiments are shown.

