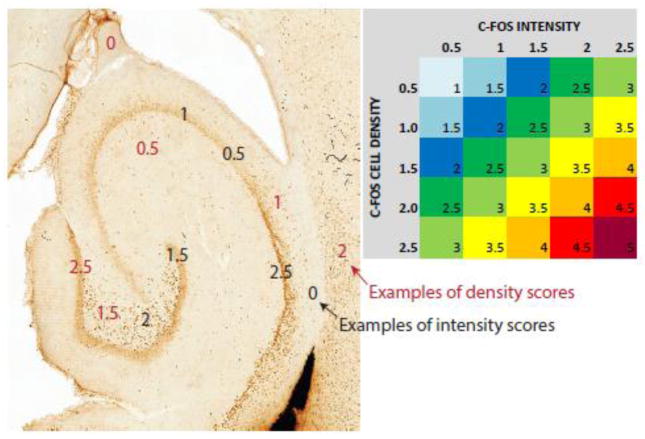
Figure 1. Grading and color coding.
C-Fos staining was graded on two independent scales, 0.5 to 2.5 for the density (number of stained cells/unit area) and 0.5 to 2.5 for intensity (darkness of staining/cell) in all analyzed brain regions. Examples of density scoring are shown in red font and of intensity scoring in black font. The numbers for density and intensity were added to provide single scores, which were plotted in Table 2.

