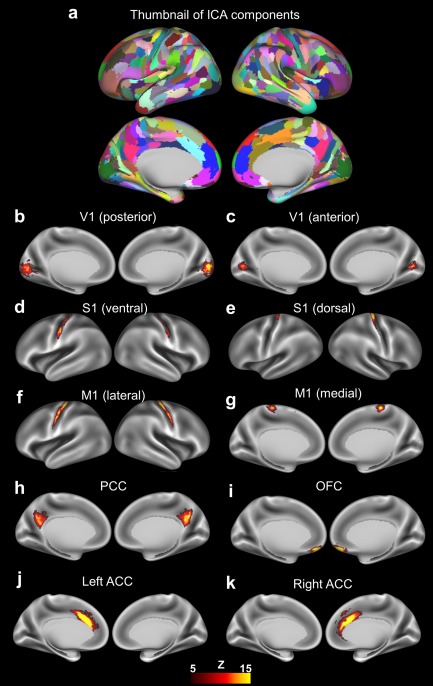
Figure 2.

(a) Spatial patterns of non‐artefactual ICA components with each component displayed in a different color. (b–k) Spatial maps of representative ICA components (thresholded at Z > 5) of myelination covariance displayed on inflated brain surfaces. V1, primary visual cortex; S1, primary sensory cortex; M1, primary motor cortex; PCC, posterior cingulate cortex; OFC, orbital frontal complex; ACC, anterior cingulate cortex. [Color figure can be viewed at http://wileyonlinelibrary.com]
