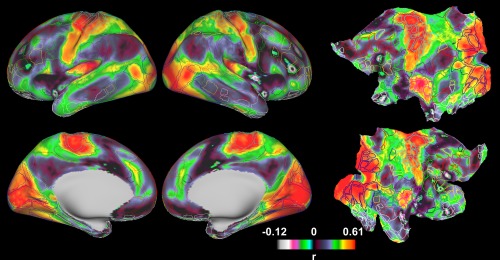
Figure 4.

Grayordinate‐wise myelination covariance–RSFC correlation map displayed on inflated (columns 1 and 2) and flattened surfaces (column 3). To facilitate the comparison of this correlation map to RSN patterns, on the same brain surfaces, the borders of parcels generated by a RSFC‐based parcellation scheme (Gordon et al., 2016) are delineated and color coded based on the RSN they belong to. [Color figure can be viewed at http://wileyonlinelibrary.com]
