
Figure 2. The 3 Most Significant Differentially Methylated Regions (DMRs).
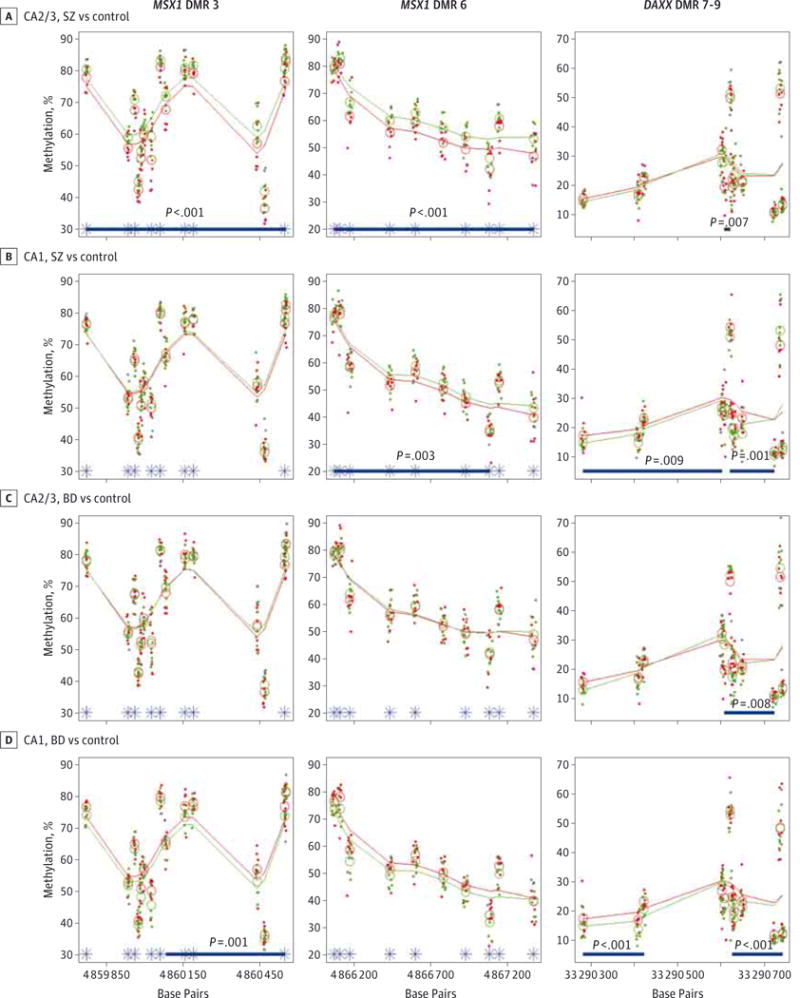
The 3 most significant DMRs are depicted, with each column representing a single genomic region. The DMRs are numbered from the p end to the q end of the genomic region associated with each gene (MSX1 DMR 3, MSX1 DMR 6, DAXX DMR 7–9). Group comparisons are shown for cornu ammonis 2/3 (CA2/3) for patients with schizophrenia (SZ) vs control participants (A), CA1 for patients with SZ vs control participants (B), CA2/3 for patients with bipolar disorder (BD) vs control participants (C), and CA1 for patients with BD vs control participants (D). Each point represents the DNA methylation level at the corresponding site in a single sample, with percentage of methylation vs genomic location. Open circles indicate group averages at each measured site; smoothed lines, running group averages; green, patients with SZ or BD; red, control participants; blue bars, footprint of an identified DMR for that comparison with the associated P value; and asterisks, location of differentially methylated positions.