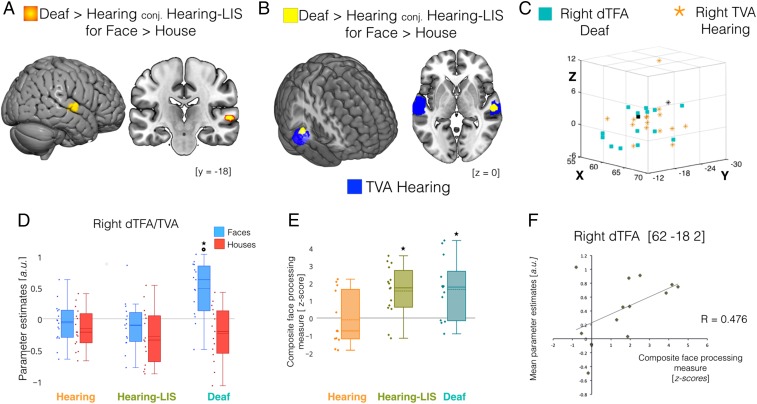
Fig. 1.
Cross-modal recruitment of the right dTFA in the deaf. Regional responses significantly differing between groups during face compared with house processing are depicted over multiplanar slices and renders of the MNI-ICBM152 template. (A) Suprathreshold cluster (P < 0.05 FWE small volume-corrected) showing difference between deaf subjects compared with both hearing subjects and hearing LIS users (conj., conjunction analysis). (B) Depiction of the spatial overlap between face-selective response in deaf subjects (yellow) and the voice-selective response in hearing subjects (blue) in the right hemisphere. (C) A 3D scatterplot depicting individual activation peaks in mid STG/STS for face-selective responses in early deaf subjects (cyan squares) and voice-selective responses in hearing subjects (orange stars); black markers represent the group maxima for face selectivity in the right DTFA of deaf subjects (square) and voice selectivity in the right TVA of hearing subjects (star). (D) Box plots showing the central tendency (a.u., arbitrary unit; solid line, median; dashed line, mean) of activity estimates for face (blue) and house (red) processing computed over individual parameters (diamonds) extracted at group maxima for right TVA in each group. *P < 0.001 between groups; P < 0.001 for faces > houses in deaf subjects. (E) Box plots showing central tendency for composite face-processing scores (z-scores; solid line, median; dashed line, mean) for the three groups; *P < 0.016 for deaf > hearing and hearing-LIS > hearing. (F) Scatterplot displaying a trend for significant positive correlation (P = 0.05) between individual face-selective activity estimates and composite measures of face-processing ability in deaf subjects.

