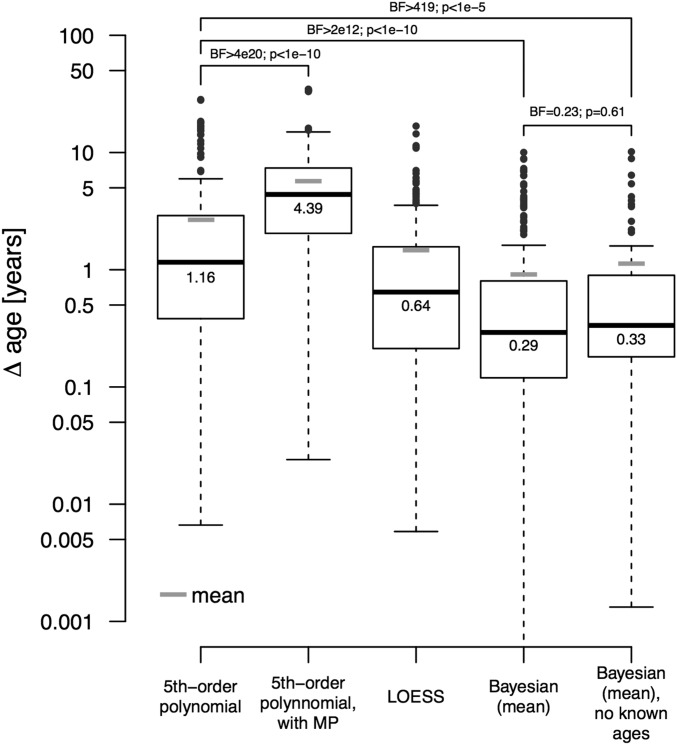
Fig. 1.
Validation and benchmarking of the Bayesian approach. Box plots of absolute differences between estimated and known ages for all 65 individuals in all five partitions from the Headland database of Agta (15) are shown (also Fig. 2) for five different methods of estimation (i.e., fifth-order polynomial, fifth-order polynomial with midpoint age estimations, LOESS, Bayesian posteriors approximated by the mean, and Bayesian posteriors computed without taking into account known ages approximated by the mean). Note that the latter distribution without known ages only comprises 65 differences because no multiple partitions exist. Statistical comparisons are performed with Bayesian t tests quantifying the strength of evidence for different means of the logged distributions via BFs (BF > 3 is considered as positive evidence; BF > 150 is considered as strong evidence) and two-sided nonparametrical KS tests assessing difference between distributions (all pairwise comparisons are provided in SI Appendix, Table S2). The y axis is in log-scale to highlight the majority of differences that are below 10 (raw values are provided in SI Appendix, Fig. S6).

