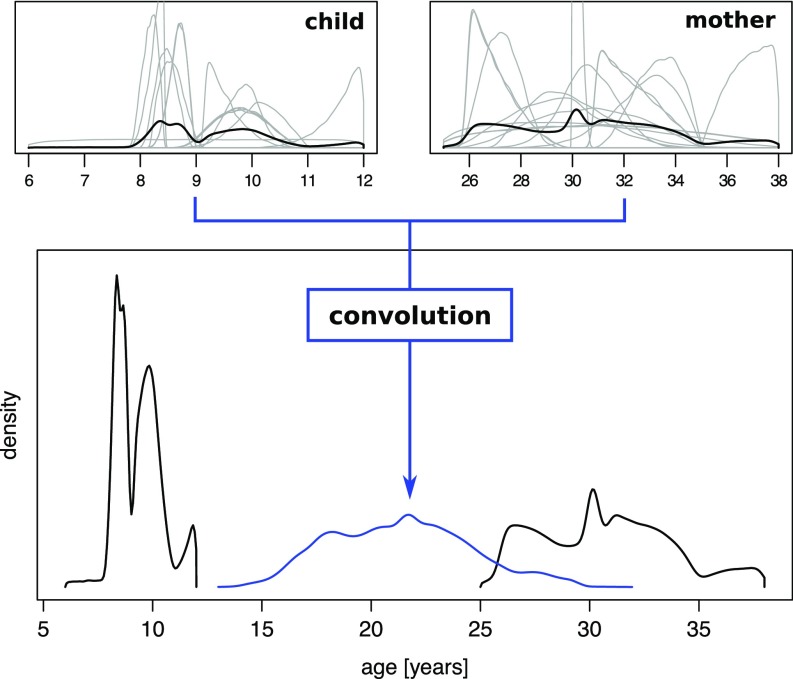
Fig. 3.
Integrating uncertainties to estimate the mother’s age at parturition. (Upper) illustrations of how distinct partial rankings of individuals are combined by averaging the resulting age distributions (gray density curves) to give an overall age distribution (black density curves) per individual. The pair of individuals was chosen to be mother [Right Upper; right distribution (Lower)] and child [Left Upper; left distribution (Lower)], allowing us to “convolve” (Materials and Methods) the age distributions and obtain the posterior distribution of the mother’s age (Lower, blue density curve) at parturition.

