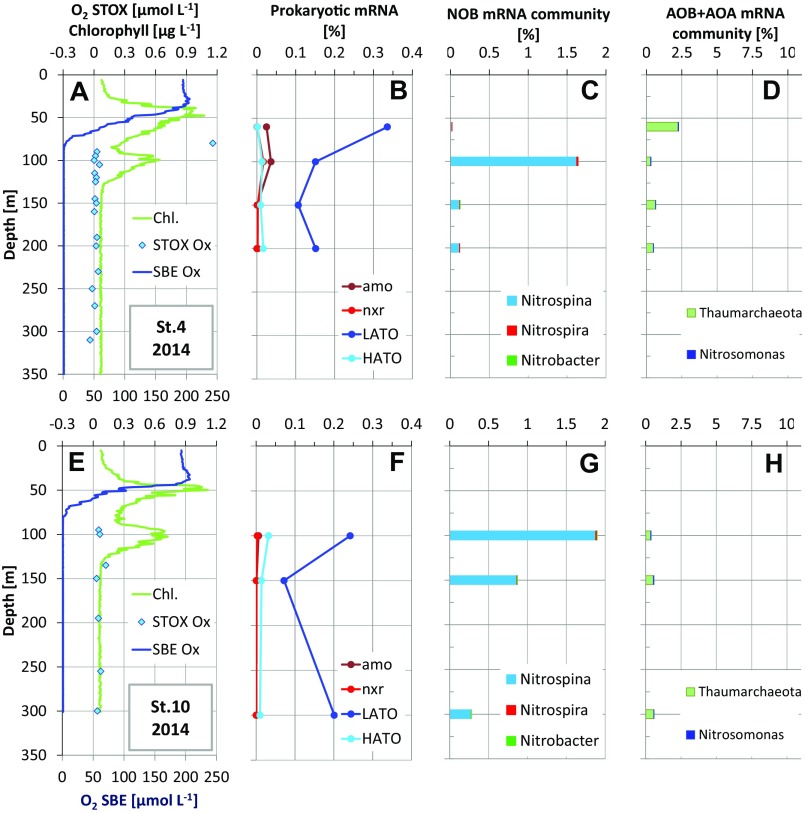
Fig. S2.
Water column dissolved oxygen (O2) and chlorophyll concentrations and microbial transcript abundances at stations (A–D) T4 and (E–H) T10 in the ETNP in 2014. (A and E) O2, based on SBE and STOX senor measurement, and chlorophyll inferred from in vivo fluorescence. (B and F) Abundances of transcripts encoding LATO and HATO, amo, and nxr, as a percentage of total prokaryotic mRNA. (C and G) Taxonomic classification of total mRNA affiliated with NOB and (D and H) AOB and AOA, as a percentage of total prokaryotic mRNA.

