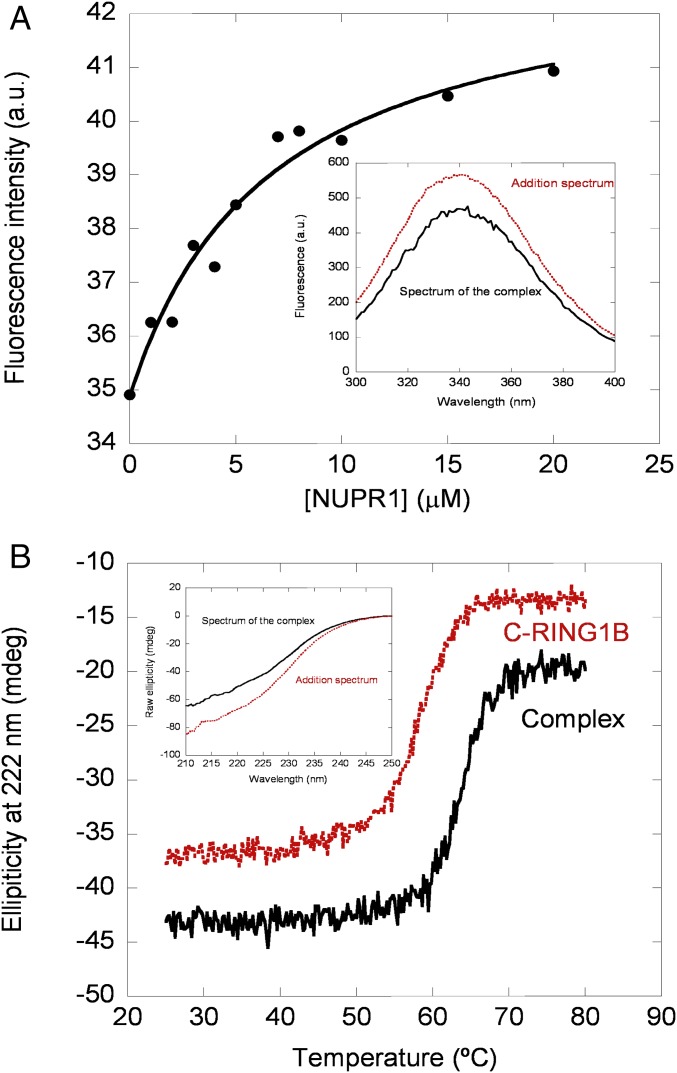
Fig. 1.
Spectroscopic characterization of the binding between C-RING1B and wild-type NUPR1. (A) Changes in the intensity at 330 nm with increasing amounts of wild-type NUPR1 after excitation at 295 nm. The line through the data is the fitting to Eq. 1, yielding a Kd of 6 ± 2 μM. (Inset) Fluorescence spectra of the complex between wild-type NUPR1 and C-RING1B (continuous black line) and that obtained by the addition of the spectra of each protein (dotted red line). (B) Thermal denaturations followed by the changes in ellipticity at 222 nm of the complex of the two proteins and that of isolated C-RING1B. (Inset) Far-UV CD spectra of the complex (continuous black line) and that obtained by the addition of the spectra of each protein (dotted red line). a.u., arbitrary units; mdeg, millidegrees.

