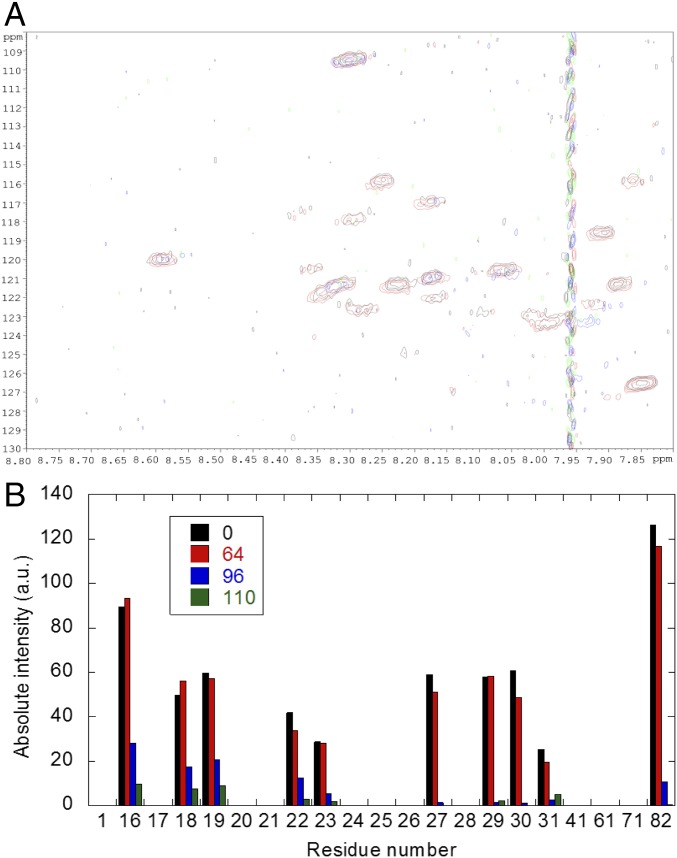
Fig. 3.
Interaction of wild-type NUPR1 and C-RING1B mapped by HSQC spectra of NUPR1. (A) Overlay of wild-type NUPR1 spectra in the presence of different amounts of C-RING1B: 0 (black), 64 (red), 96 (blue), and 110 (green) μM (all indicated in protomer units). (B) Intensity decrease of cross-peaks (corrected by the value of the receiver gain of the spectrometer in each titrating point) in the 1H-15N HSQC spectra of wild-type NUPR1 as [C-RING1B] was increased (color code is the same as above). The signals appearing between 8.15 and 8.30 (1H dimension) and between 123 and 121 ppm (the 15N one) could not be unambiguously assigned. a.u., arbitrary units.

